German Electricity Price Forecasting
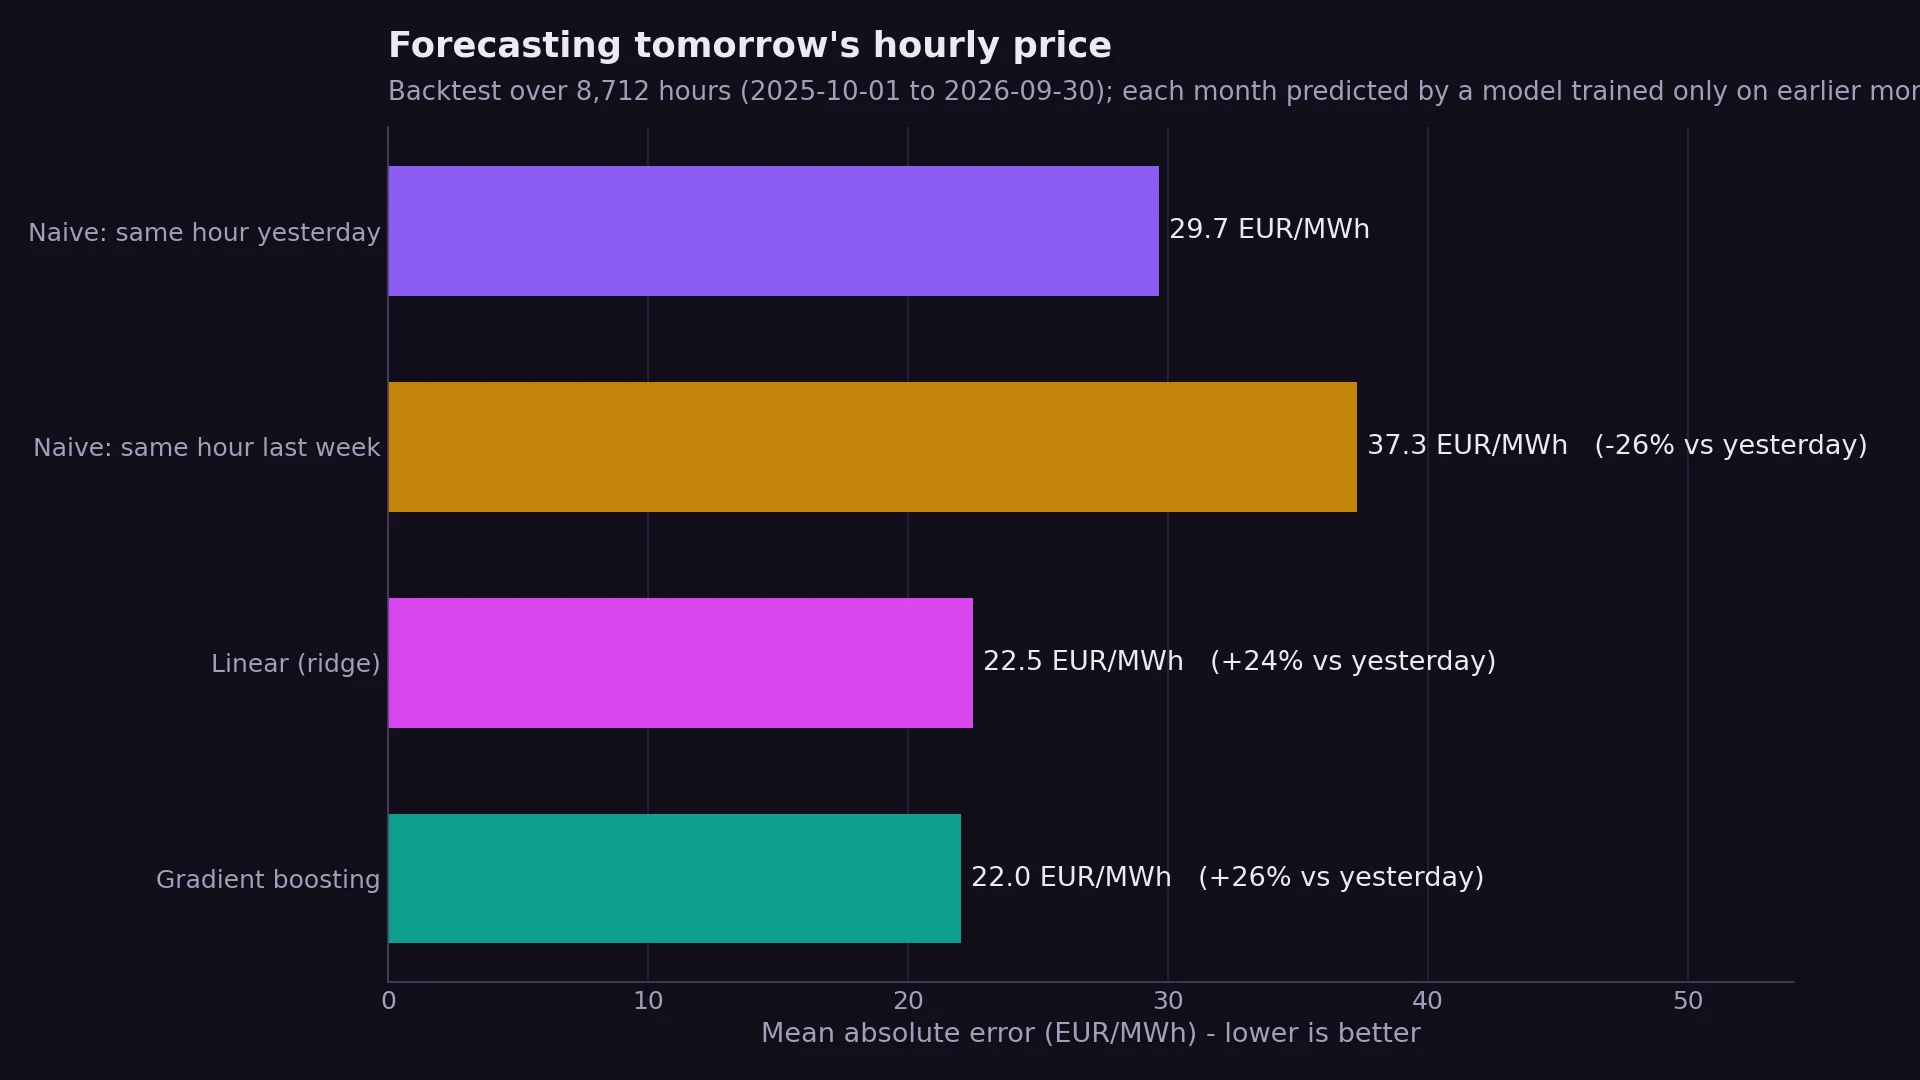
Forecasting tomorrow's hourly electricity price for Germany from public SMARD data, with auction-safe features and a year-long rolling backtest: 26% lower error than the standard naive forecast.
- 26% lower error than naive
- 8,712-hour rolling backtest
- Leakage-tested features
Problem
Every day at 12:00 the EPEX SPOT day-ahead auction sets Germany’s electricity price for each hour of the next day. Prices swing from below zero on sunny, windy middays to several hundred EUR/MWh on calm evenings. Battery operators, flexible industry and traders need a forecast before the auction, so the forecast may only use what is known at that moment.
Data
Public data from SMARD.de, the market-data platform of the Federal Network Agency (Bundesnetzagentur): 70,366 hourly prices from October 2018 to October 2026, plus actual grid load and the grid operators’ day-ahead forecasts of wind, solar and total generation.
Approach
- Exploration first: a notebook on twelve weeks of live prices found the duck curve (cheapest at 13:00 on average, priciest at 20:00), a 42.56 EUR/MWh weekend discount and 8.4% negative-price hours.
- Features that respect the auction timing: prices of the same hour 1 and 7 days earlier, load 2 and 7 days earlier, the day-ahead forecasts of wind and solar for the hour, and calendar effects. A test changes single values and checks that no feature ever uses future data.
- Models: two naive baselines, ridge regression and gradient boosting.
- Rolling-origin backtest: each of the last 12 months is predicted by models retrained only on earlier data, 8,712 hours in total.
Results
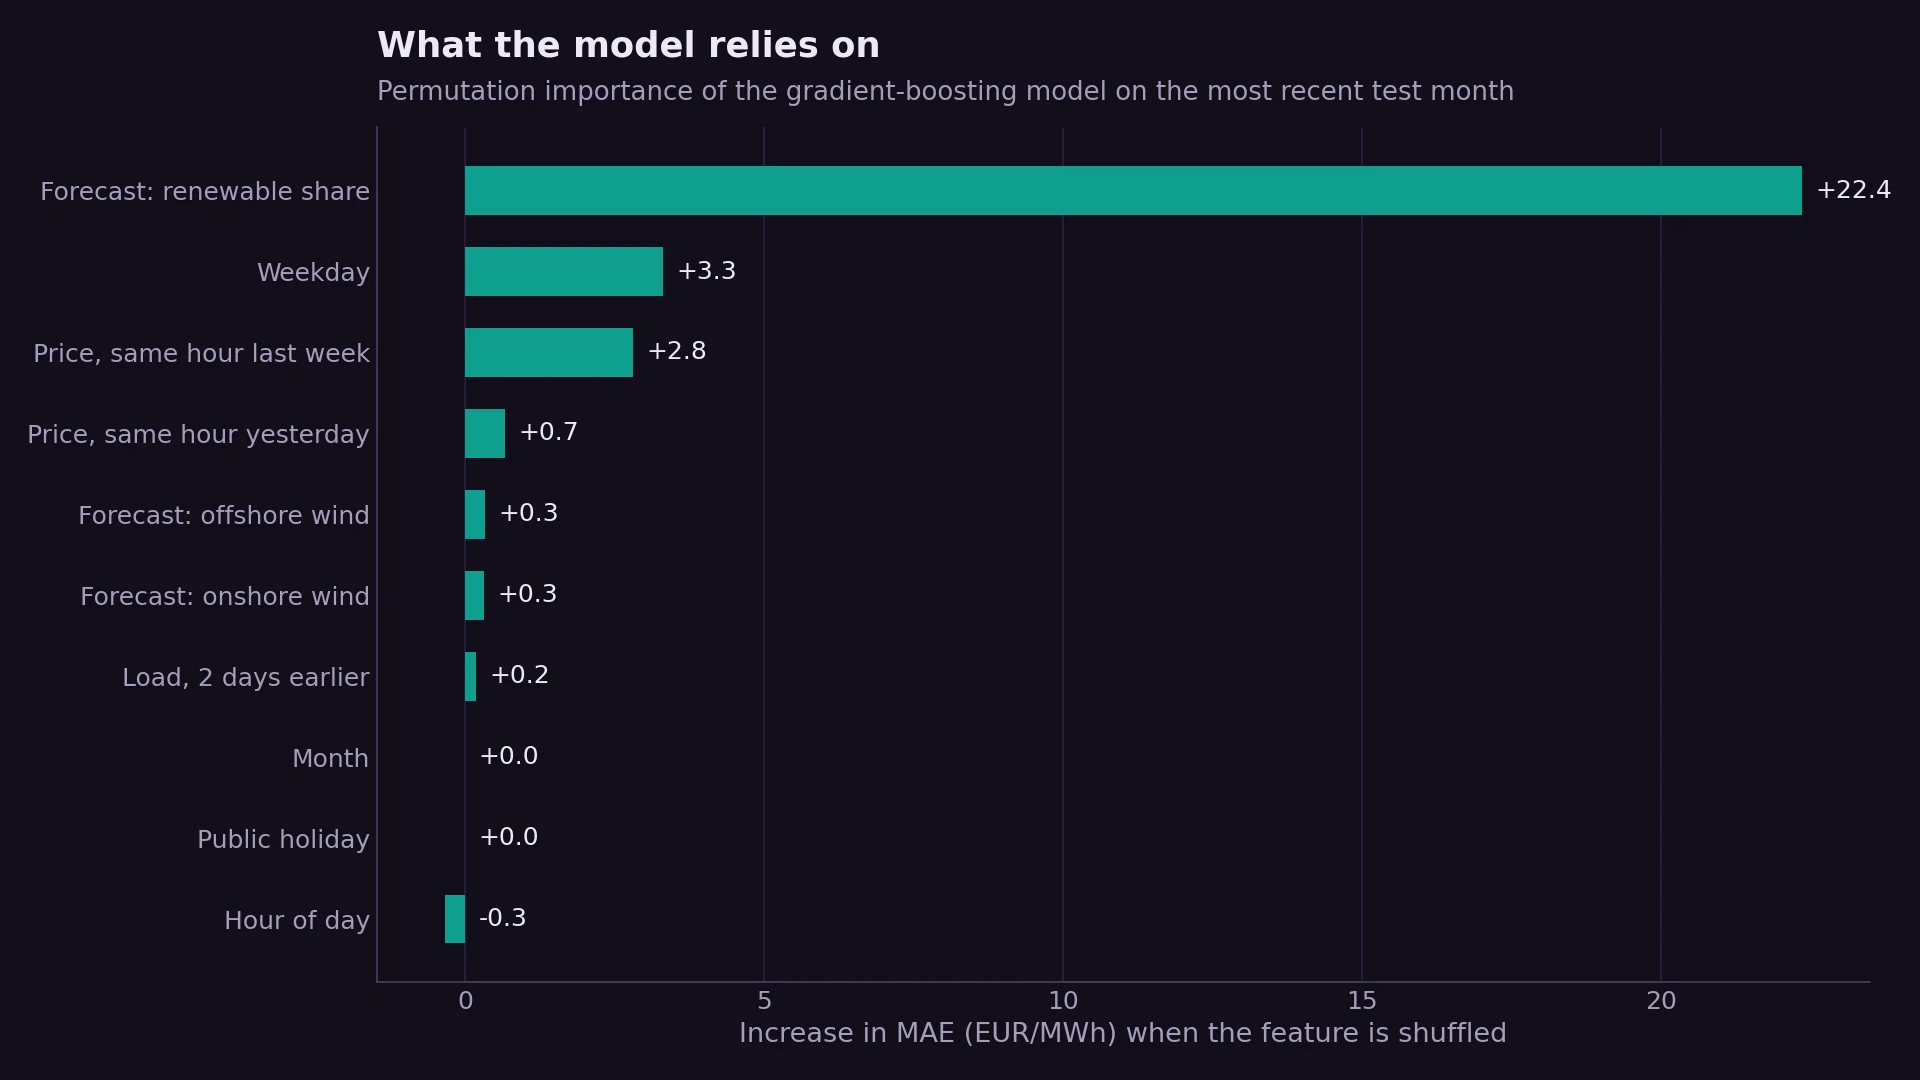
- The renewable share is what matters. Shuffling the forecast share of wind and solar raises the error by 22 EUR/MWh, far more than any other feature.
- The linear model is almost as good (22.5). Most of the gain comes from choosing the right features; gradient boosting adds a little on extreme hours, such as the 508 negative-price hours (error 24.1 vs 40.5 for yesterday’s price).
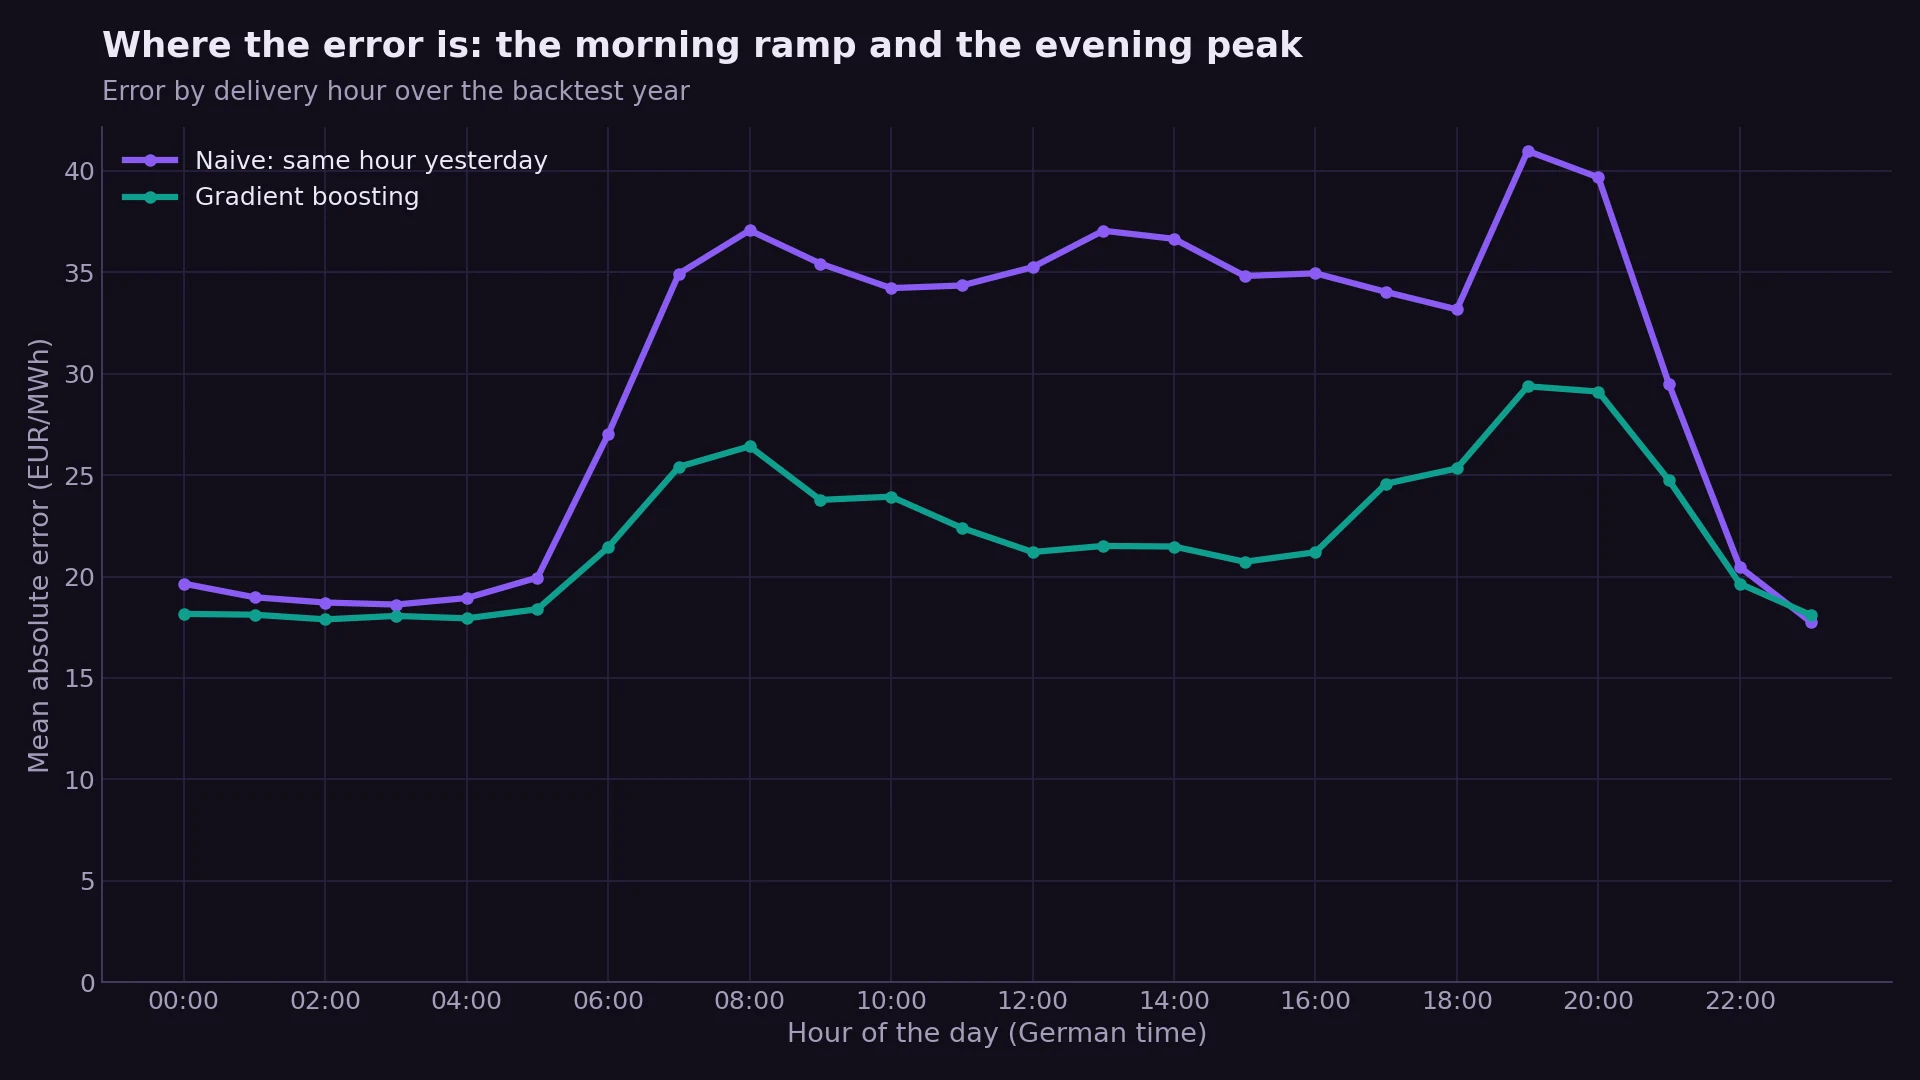
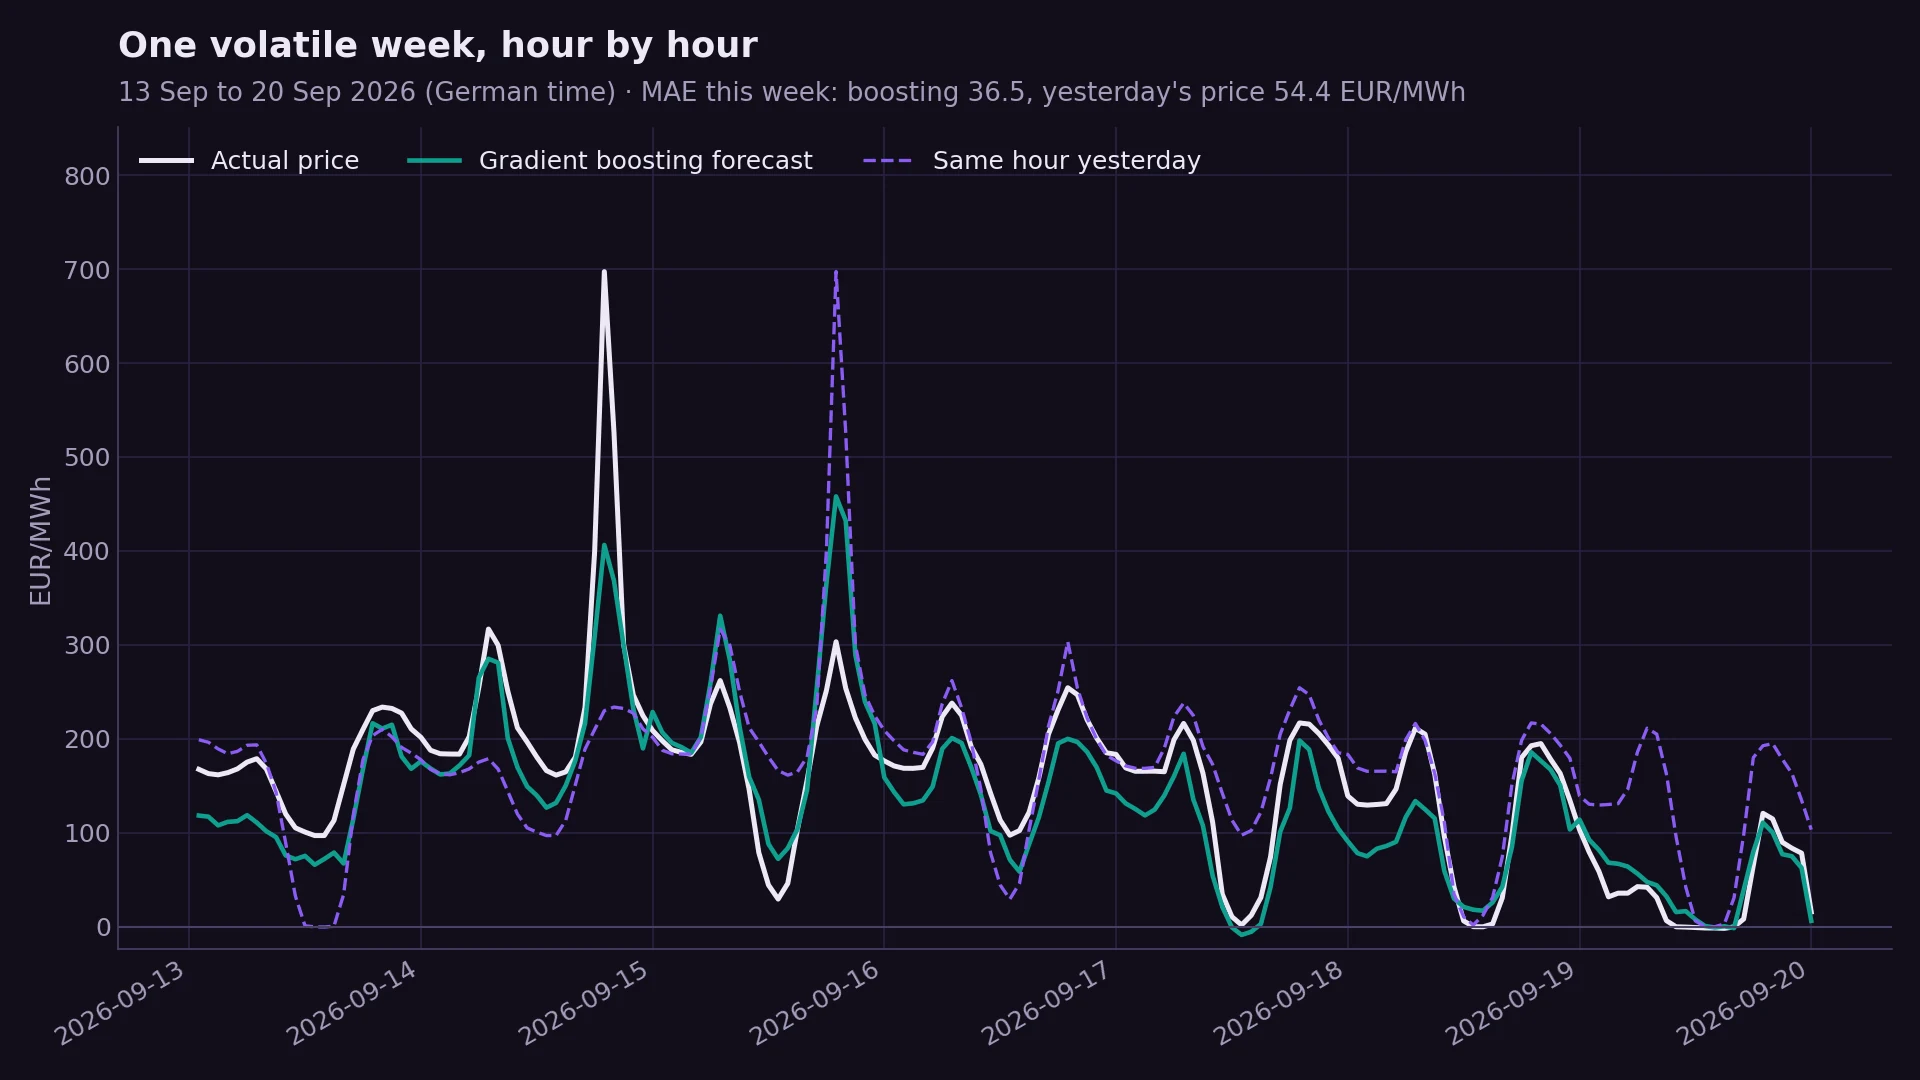
Limitations: errors grew in summer 2026 (monthly MAE 30–39 EUR/MWh in July–September, against 15–18 earlier) as evening spikes reached 600–700 EUR/MWh. Gas prices, plant outages and cross-border flows aren’t in the data, and the model gives point forecasts, not ranges.
What I learned
- Timing is the hard part of forecasting. A model that accidentally sees today’s actual wind would look far better than it is; writing down when each input becomes available, and testing it, is what makes the result trustworthy.
- Baselines keep you honest. “Same hour yesterday” is a strong benchmark, and a simple linear model already captures most of the improvement.