Gut Transit in ICU Trauma Patients (Biostatistics)
A statistical replication of Rauch et al. (2012): do ventilated trauma patients digest more slowly? SmartPill capsule data from 8 ICU patients and 87 healthy volunteers, re-analysed in JASP and Python.
- Gastric emptying 4.5× slower
- Mann–Whitney p < .001
- Pearson vs Spearman flips a result
Problem
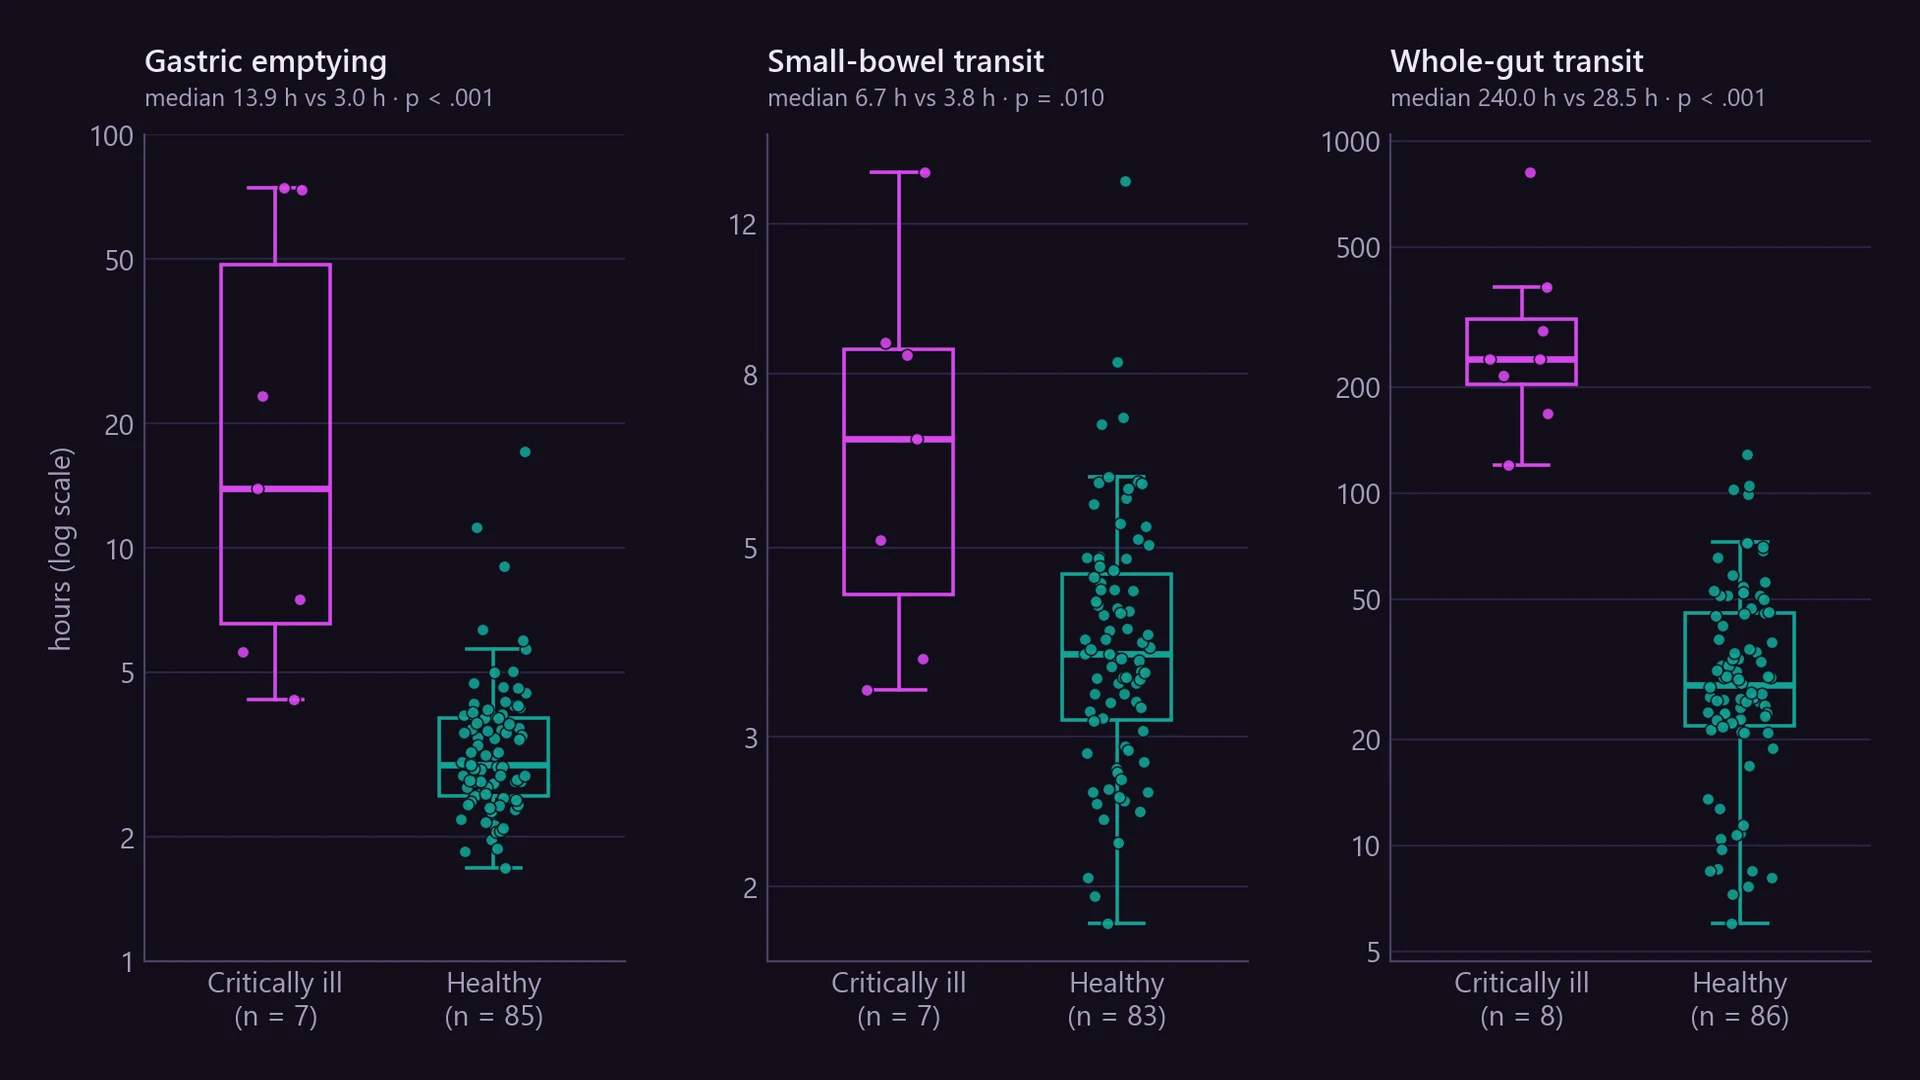
M.Sc. project for the Statistics & Machine Learning module (SRH University, winter term 2025/26). Critically ill patients often can’t tolerate tube feeding, and slow gut motility is a suspected cause. The goal was to replicate the statistics of a published clinical study: do mechanically ventilated trauma patients have slower gastric emptying and small-bowel transit than healthy people?
Data
The public Smart Pill dataset from Rauch et al. (2012, Journal of Critical Care): 95 participants and 22 variables. 8 critically ill trauma patients and 87 healthy volunteers each swallowed a wireless capsule that records pH, pressure and temperature on its way through the gut. The outcomes are gastric emptying (GE), small-bowel (SB) and whole-gut transit times in hours.
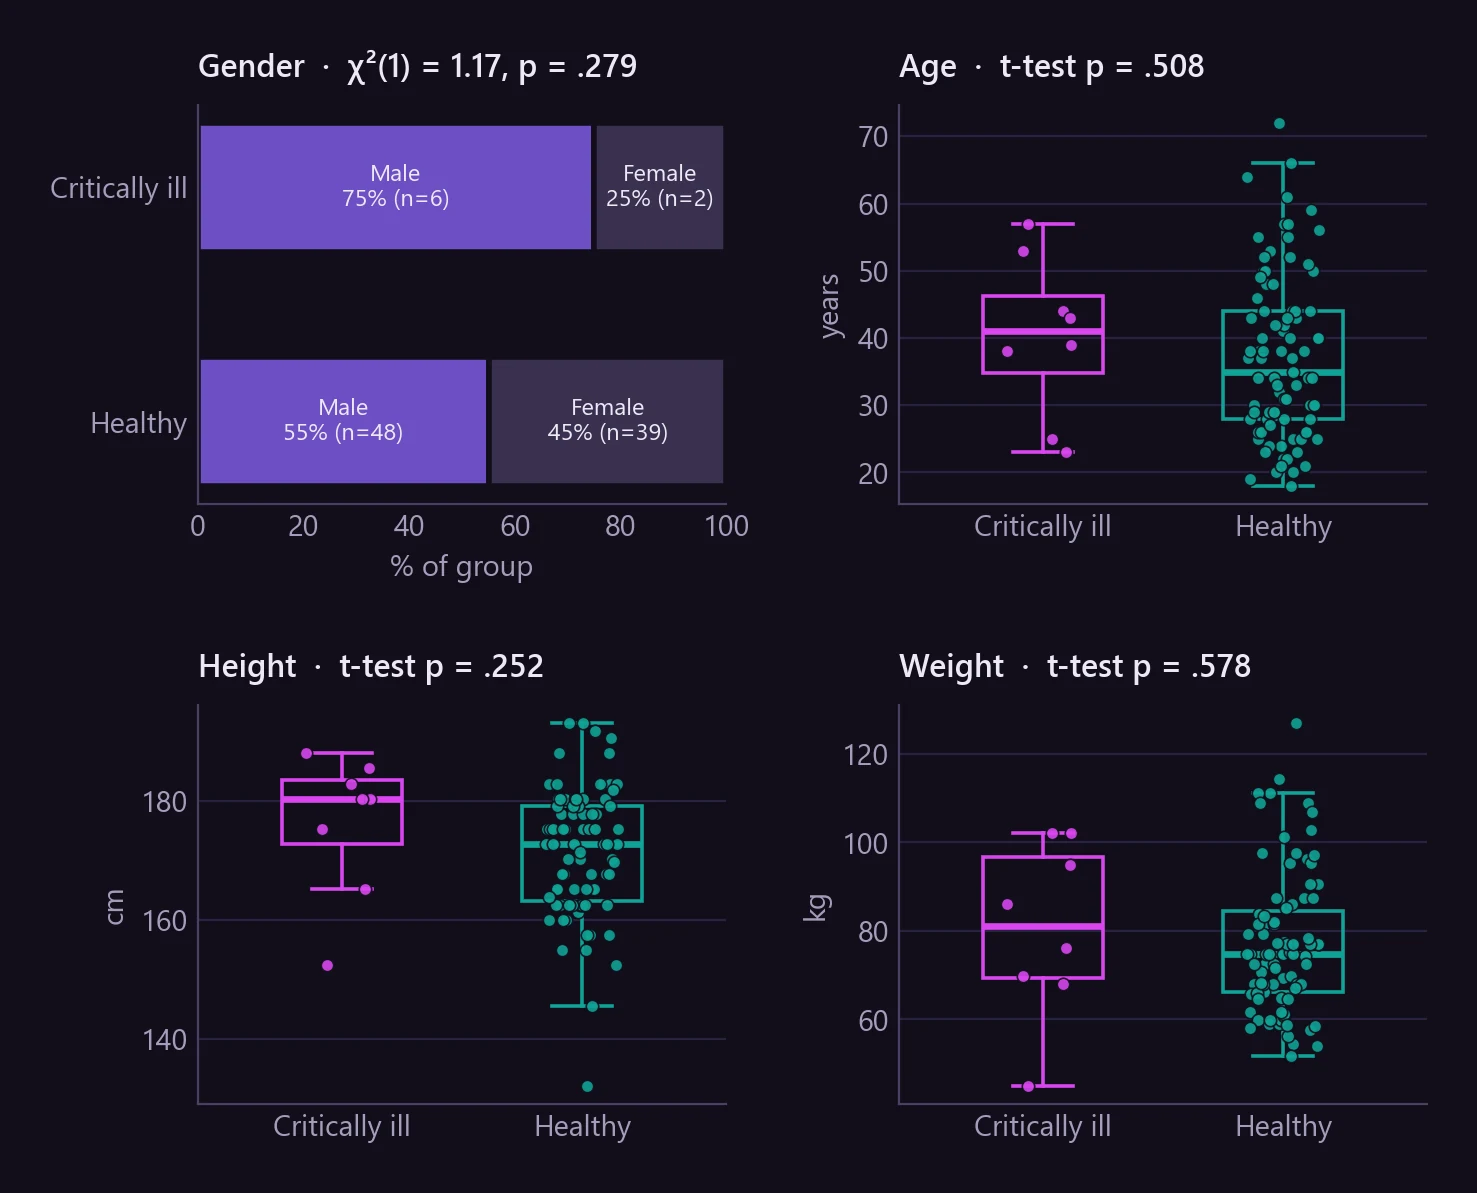
Before comparing transit times, I checked that the two groups are comparable. They don’t differ significantly in gender, age, height or weight.
Approach
- Classified the variables (nominal, ratio, interval, count) to choose suitable tests.
- Baseline balance: t-tests and Mann–Whitney U for age, height and weight; χ² and Fisher’s exact test for gender.
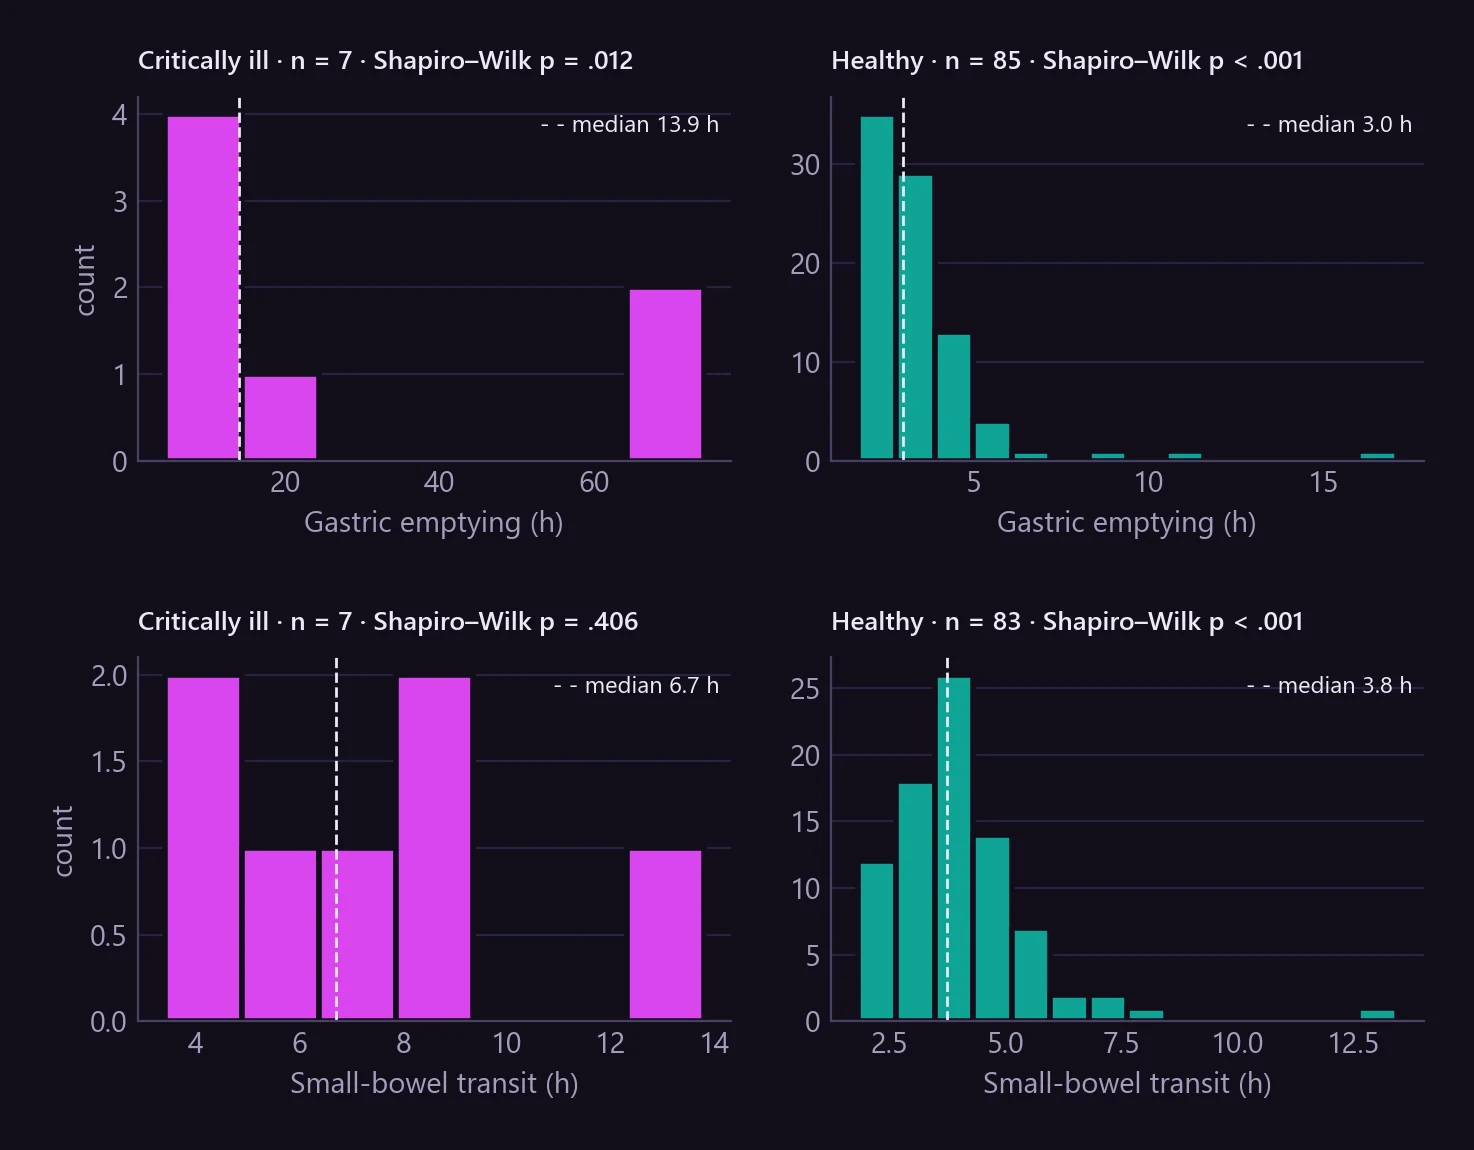
- Primary outcomes: Shapiro–Wilk normality checks, then Welch’s t-test vs Mann–Whitney U, with a Bonferroni-corrected α = 0.025 for the two primary outcomes and rank-biserial effect sizes.
- Odds ratio for delayed gastric emptying (Haldane–Anscombe correction for a zero cell), one-way ANOVA and Kruskal–Wallis by gender and race.
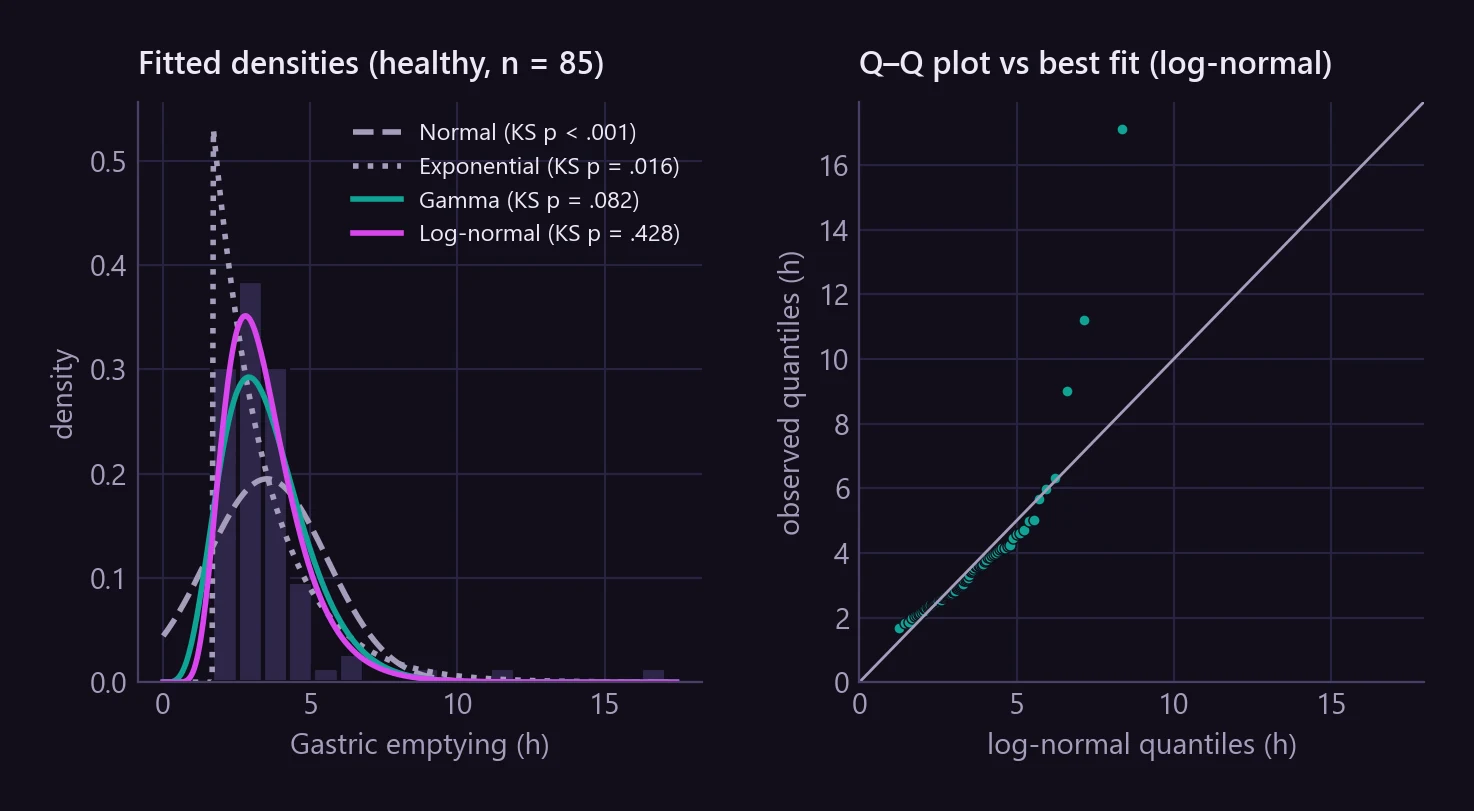
- Distribution fitting (Normal, Exponential, Gamma, Log-normal) with Kolmogorov–Smirnov tests.
- Pearson vs Spearman correlation, and a multiple regression for SB time with heteroscedasticity-robust (HC3) standard errors.
- Did the analysis first in JASP, then rebuilt it as a reproducible Python notebook.
The transit times are strongly right-skewed and fail the normality test, which is why the main comparison uses the rank-based Mann–Whitney test, not a t-test.
Results
| Outcome | Critically ill (median) | Healthy (median) | Mann–Whitney p |
|---|---|---|---|
| Gastric emptying | 13.9 h | 3.0 h | < .001 |
| Small-bowel transit | 6.7 h | 3.8 h | .010 |
| Whole-gut transit | 240 h | 28.5 h | < .001 |
- All 7 patients with a measurement had delayed gastric emptying (OR = 15.4, 95% CI 0.9–277).
- Welch’s t-test missed the gastric-emptying difference (p = .076) because a few extreme values inflate the variance. The rank-based test found it clearly.
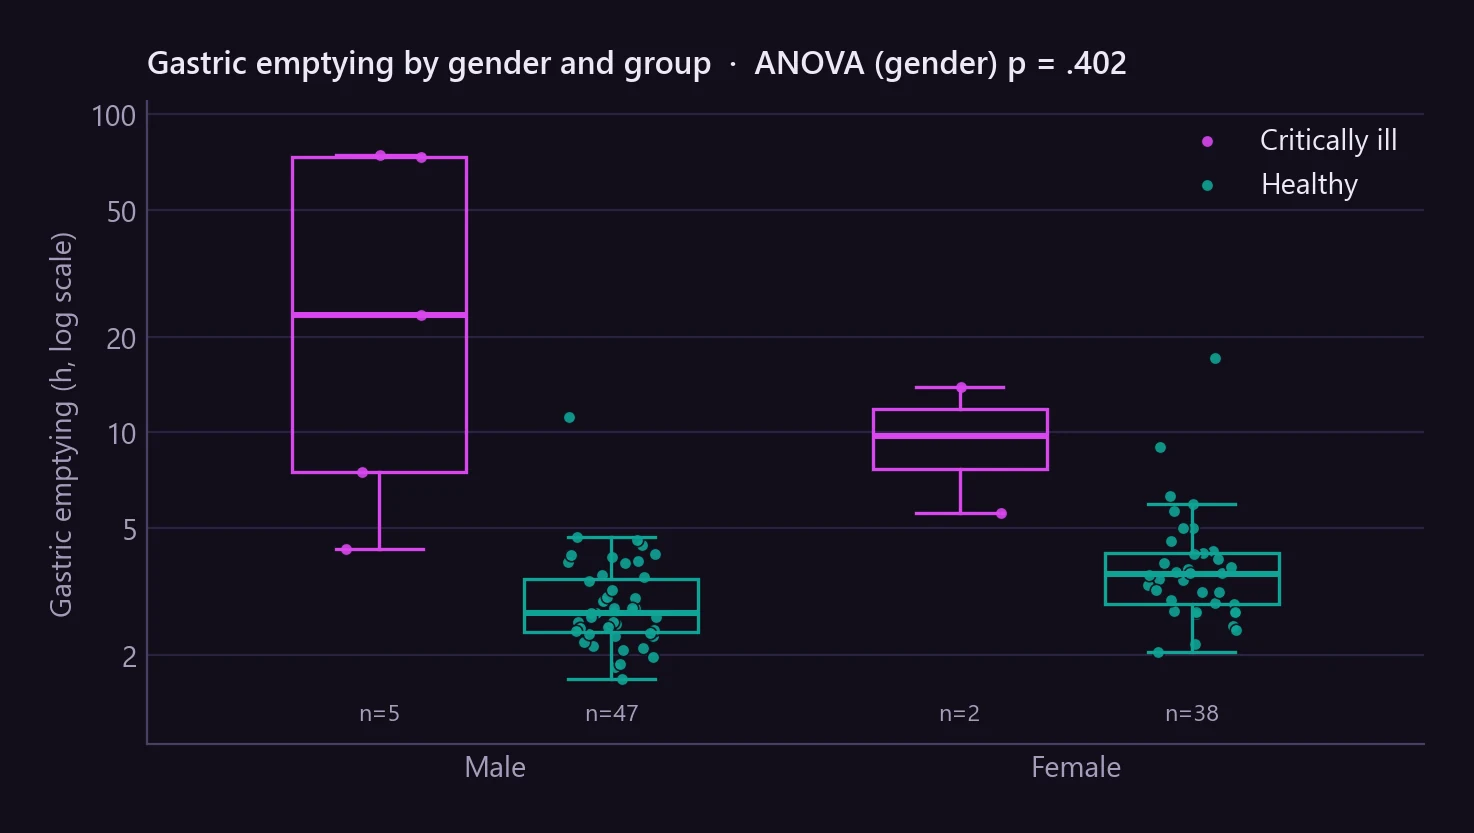
- Gender has no effect on gastric emptying (ANOVA p = .40). The difference comes from the group.
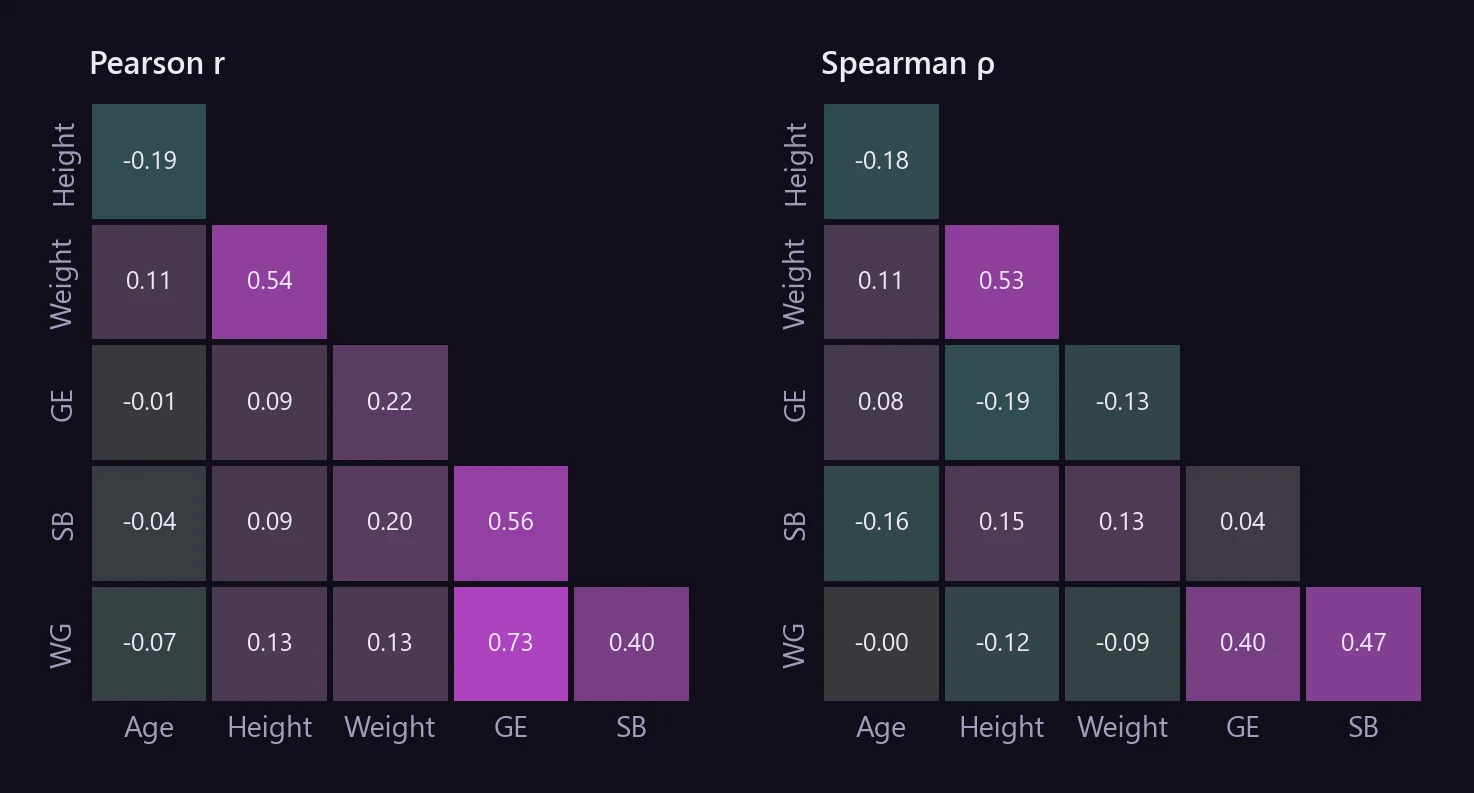
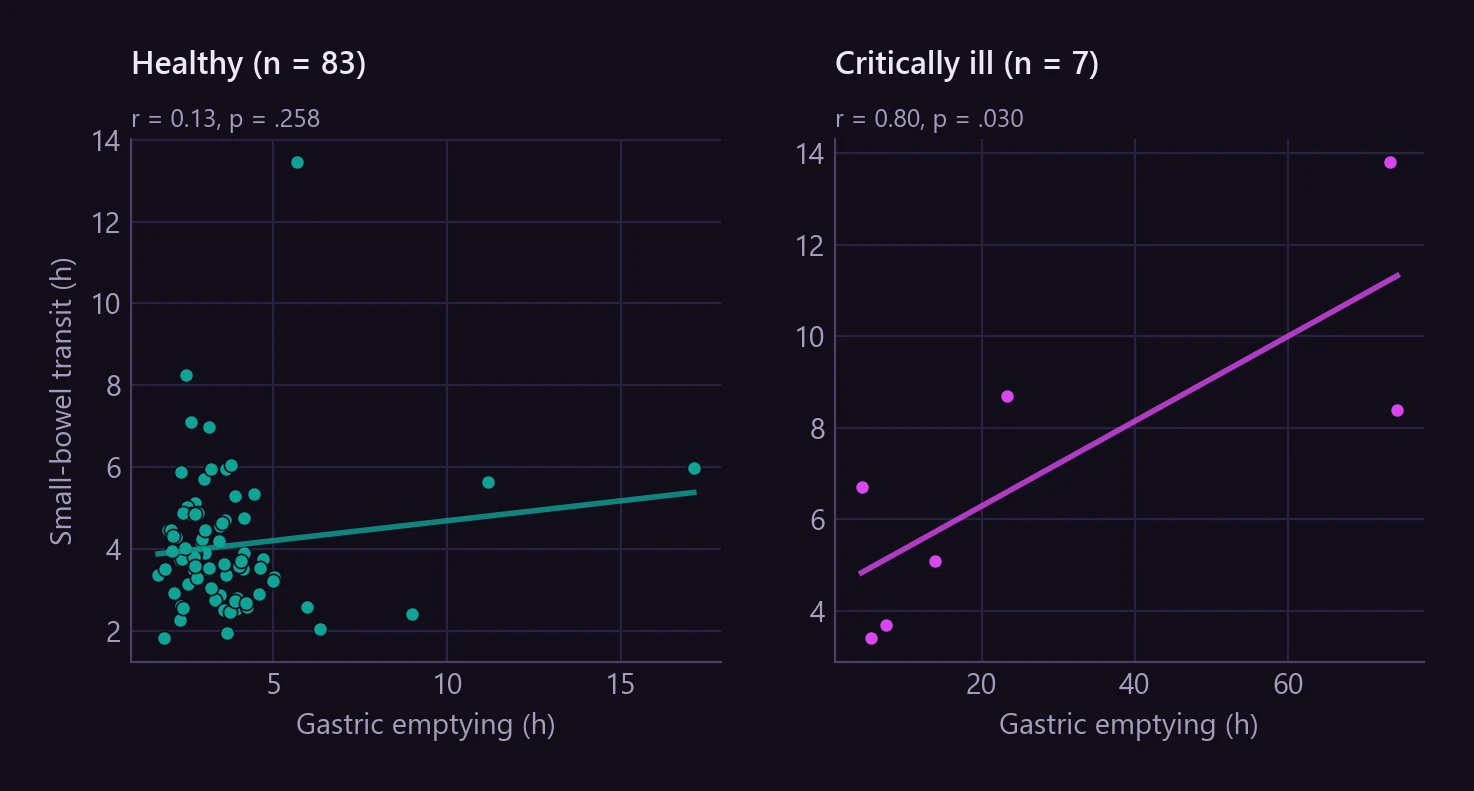
Pearson vs Spearman changes the conclusion. Pooled over both groups, the Pearson correlation between GE and SB time is r = 0.57, but Spearman’s ρ is only 0.04. In healthy volunteers there is no relationship at all. The apparent link comes from a few patients who are extreme on both variables.
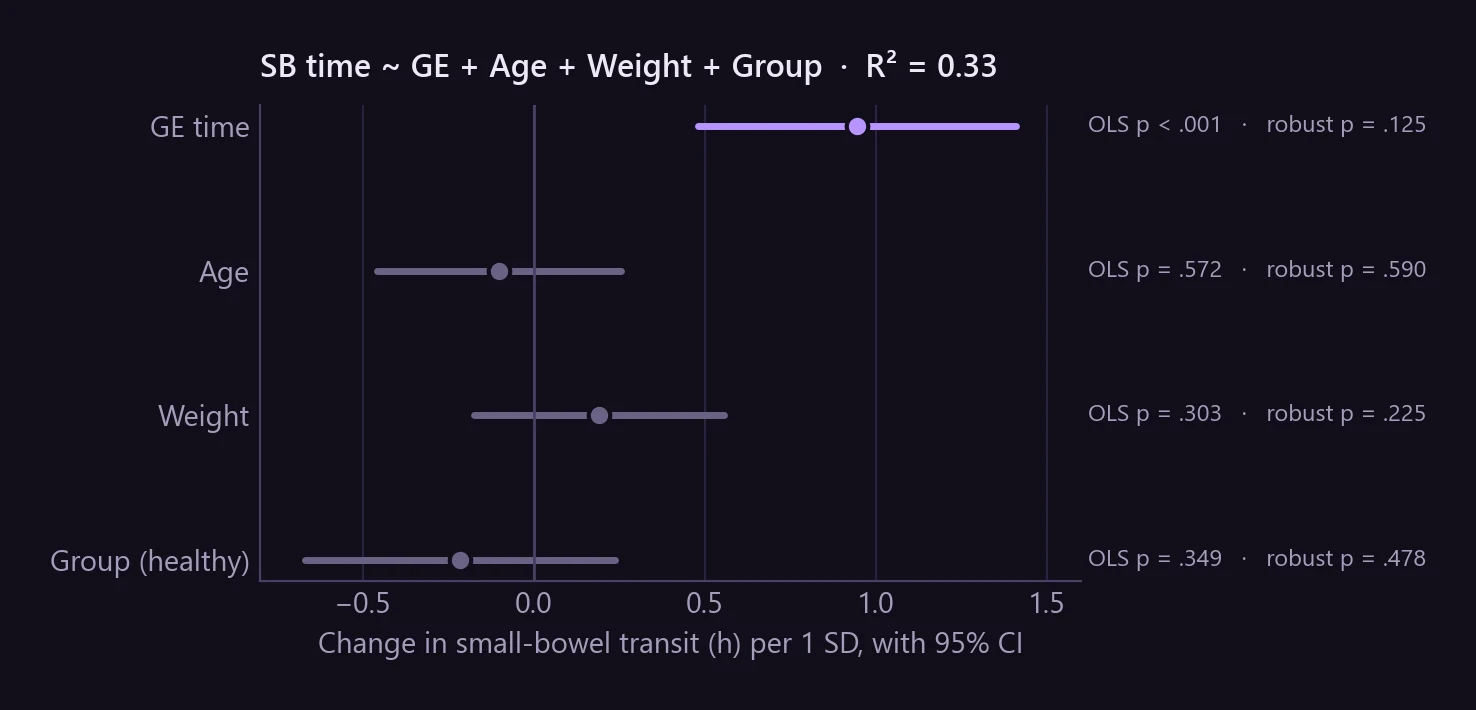
The multiple regression tells the same story. GE time looks like a strong predictor of SB time (p < .001), but with robust standard errors the effect is no longer significant (p = .125).
What I learned
- Check the assumptions before choosing a test. With skewed data and tiny groups, the “standard” t-test gives the wrong answer.
- Robust methods can change the conclusion, not just the decimals. Reporting both versions is more honest than reporting only the one that looks best.
- A significant result from 8 patients is still a pilot result. Confidence intervals show that better than p-values do.