ICU & Mortality Forecasting (COVID-19)
Forecasting COVID-19 ICU occupancy and deaths for the Netherlands, Germany, Bremen and the UK, comparing linear, Random Forest and XGBoost models with time-series backtesting.
- −87% MAE vs linear baseline
- 4 regions, 62-day holdouts
- Time-series CV
Problem
M.Sc. coursework project. Hospitals and public-health teams need to know what ICU load and mortality will look like in the coming weeks. The goal was to forecast January 2022 values for several regions and find which model family to trust for each one.
Data
Public daily COVID-19 series (ICU occupancy, deaths) for the Netherlands, Germany, the German state of Bremen, and the UK, from 2020 to January 2022.
Approach
- Lag-based features on each daily series.
- Backtest first: a 2021 backtest period to check the method, then a forecasting run with a 62-day holdout (Dec 2021 – Jan 2022).
- Compared Linear Regression, Random Forest and XGBoost, using
TimeSeriesSplitcross-validation so no model ever trains on the future. - Picked the best model per region, inspected feature importances, and exported January 2022 forecasts as CSV.
Results
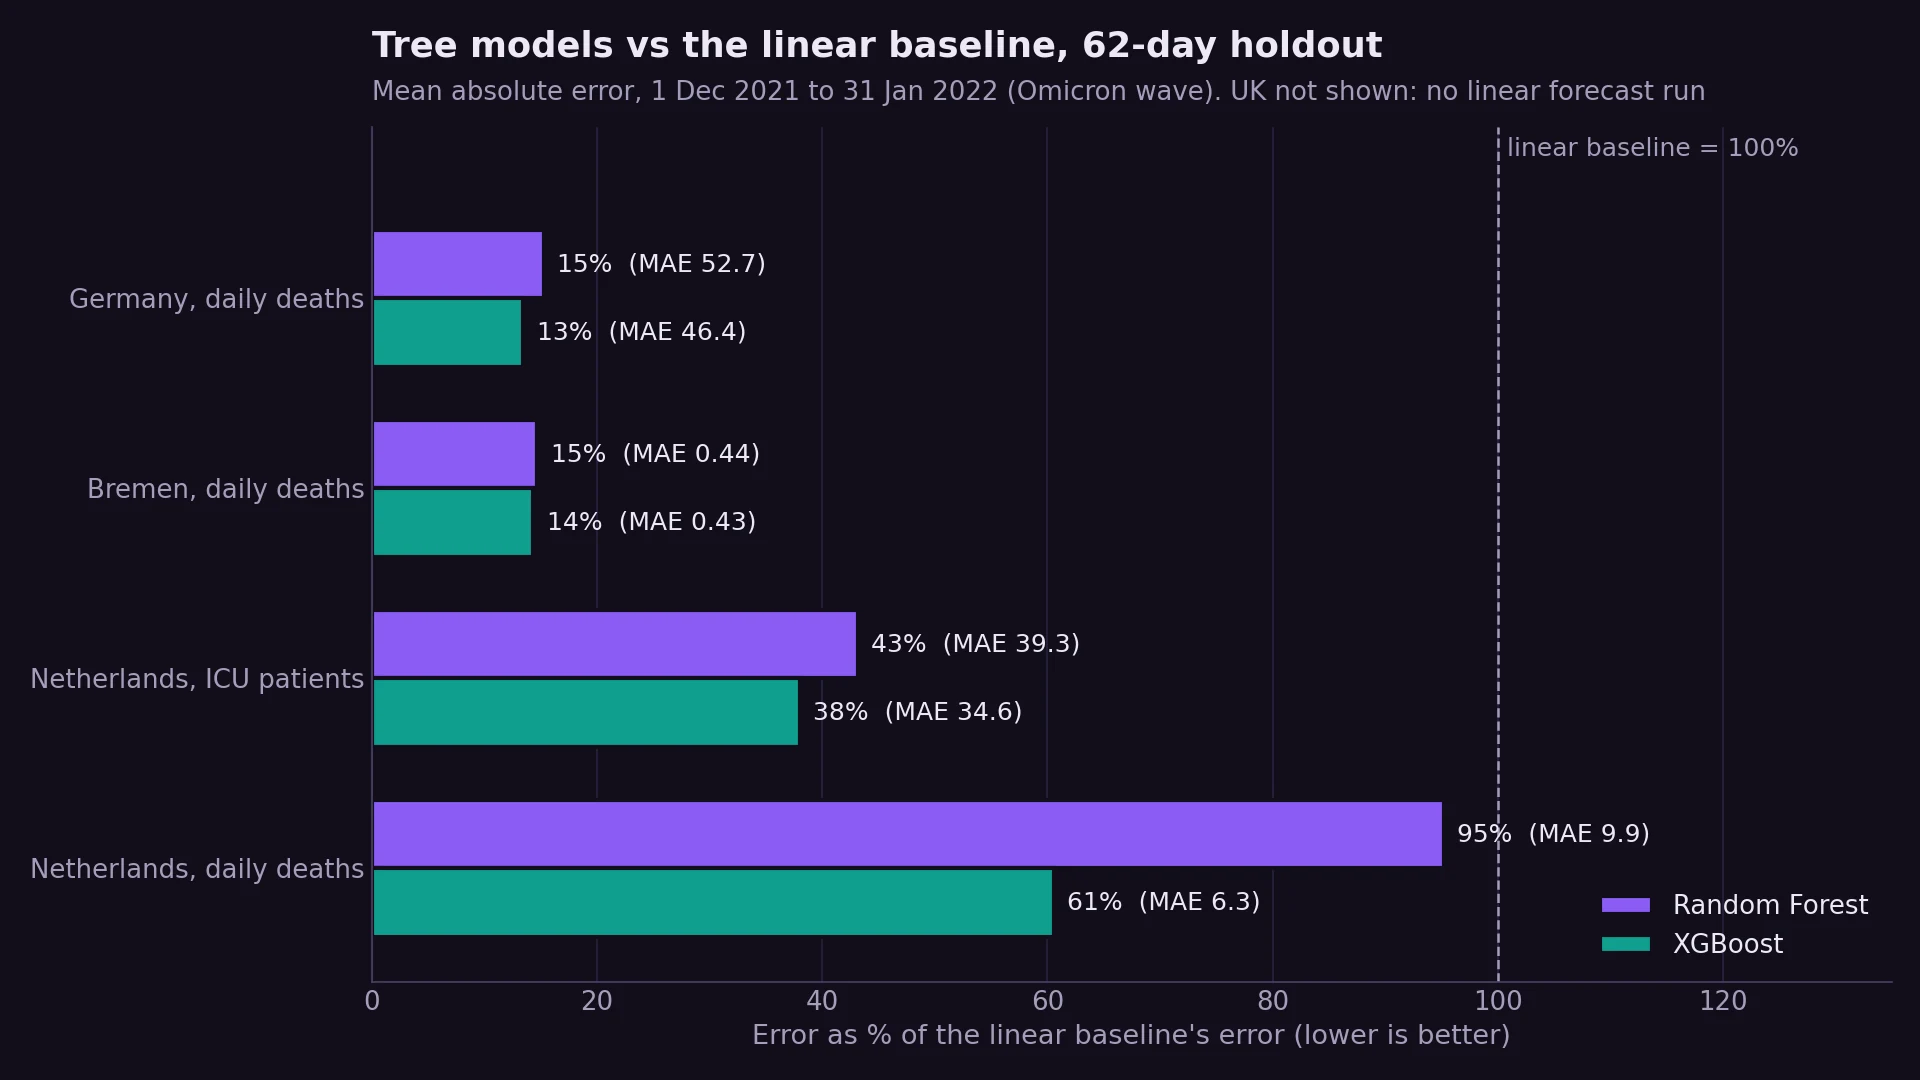
Mean absolute error on the 62-day holdout (Dec 2021 – Jan 2022, 7-day smoothed targets):
| Target | Linear | Random Forest | XGBoost |
|---|---|---|---|
| Germany, daily deaths | 345.0 | 52.7 | 46.4 |
| Netherlands, daily deaths | 10.4 | 9.9 | 6.3 |
| Netherlands, ICU occupancy | 91.1 | 39.3 | 34.6 |
| Bremen, daily deaths | 3.0 | 0.44 | 0.43 |
| UK, daily deaths | — | 19.2 | 48.8 |
- In Germany, XGBoost cut the error by 87% compared with the linear baseline.
- No single model wins everywhere. In the UK, Random Forest beat XGBoost, and cross-validation showed XGBoost’s error varied a lot between folds.
What I learned
- Honest time-series validation (backtest, then walk-forward CV) matters more than model choice. A random train/test split would have leaked the future into training.
- Look at the error for each fold, not just the mean: a model with a good average can still be unstable.