EU Safety Gate Motor Vehicle Recalls Dashboard
A Power BI dashboard on 4,184 motor-vehicle recall alerts from the EU Safety Gate system (2016–2026): brands, components, hazards and countries, with every headline card checked against an independent Python recount.
- 4,184 alerts, 2016–2026
- Cards match Python recount
- 9 data issues found and fixed
Problem
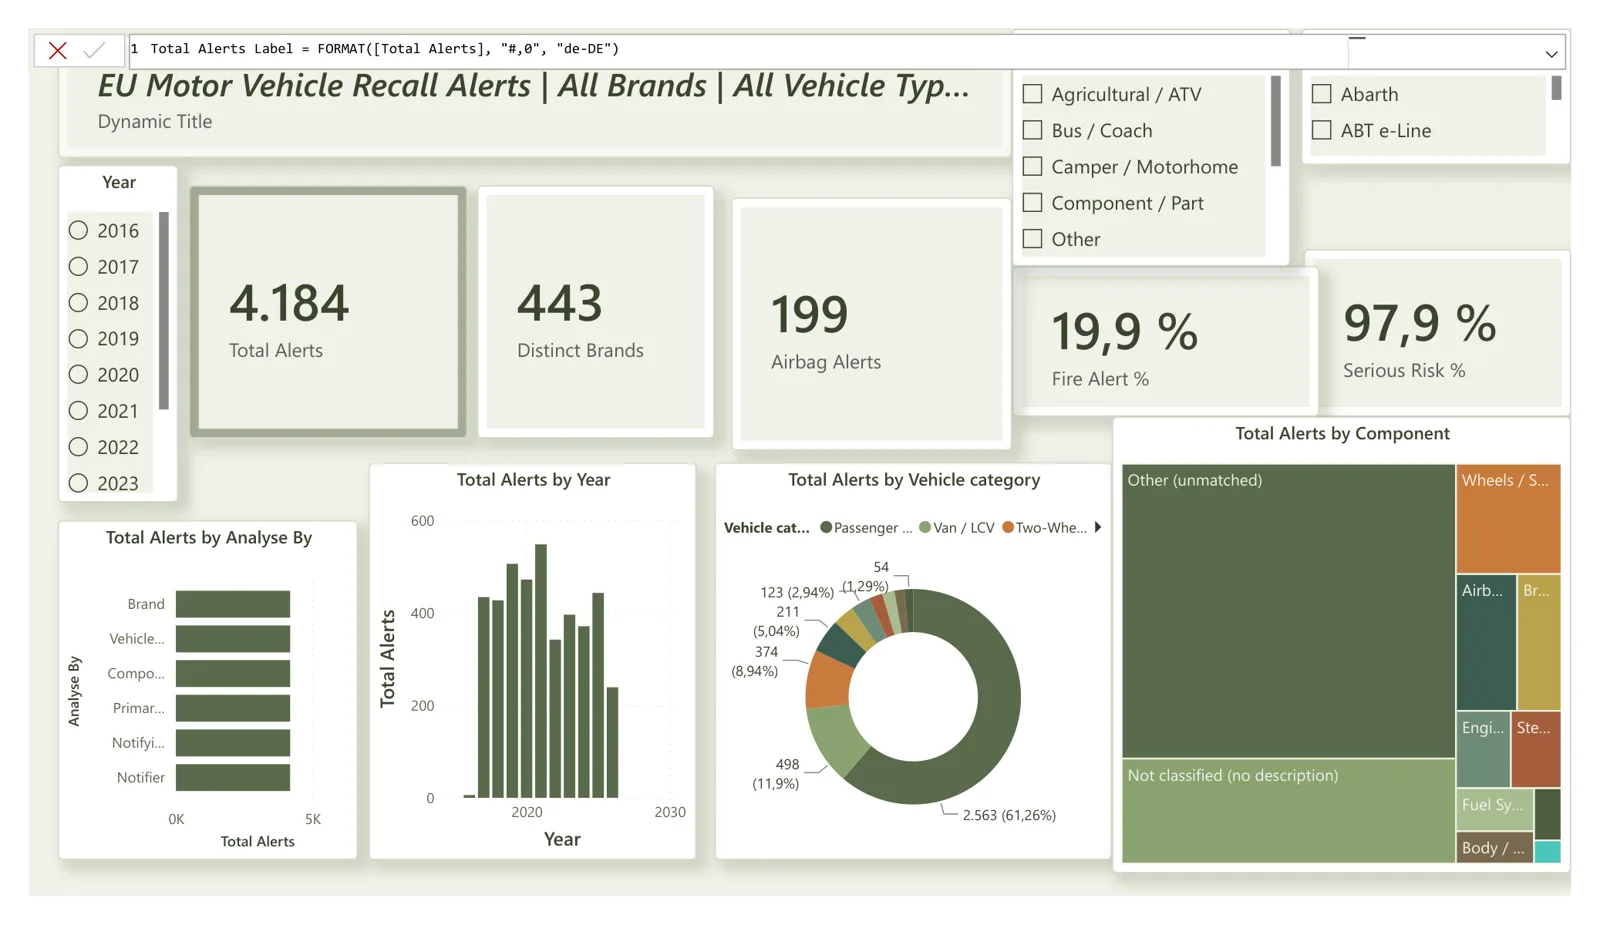
The EU Safety Gate rapid alert system publishes every dangerous product that a national authority reports, including vehicles recalled for defects. The raw export is a long spreadsheet of free text. The dashboard turns it into answers to questions a regulator, a fleet manager or a manufacturer would ask: which brands and vehicle types are recalled most, for which components and hazards, and where else in Europe the same vehicles were found.
Data
The Safety Gate export for motor vehicles, downloaded on 2 August 2026: 4,184 alerts from
2016 to 2026 (2026 is a partial year with 239). There is no notification date in the export, so
the year comes from the alert number (A12/0028/17 → 2017).
Approach
- Power Query cleans the export, takes the first brand of multi-brand alerts, fixes brand spellings, and derives the vehicle category and defective component with ordered, case-insensitive keyword rules. A second query splits the “also found in” country list into one row per alert and country.
- Star-shaped model with a year table, plus 30 DAX measures: year-on-year (suppressed for the partial current year), Top N brands, dynamic titles and short text insights.
- Four report pages: Overview, Drivers, Geography and Data Quality.
- Validation: a Python script recomputes every headline number from the raw spreadsheet, independently of Power BI.
Results
| Busiest year | 2021, 548 alerts (+16.1% on 2020) |
| Rated “Serious risk” | 97.9% of alerts |
| Fire as a hazard | 19.9% of alerts |
| Brands | 443; Mercedes-Benz has the most alerts (477) |
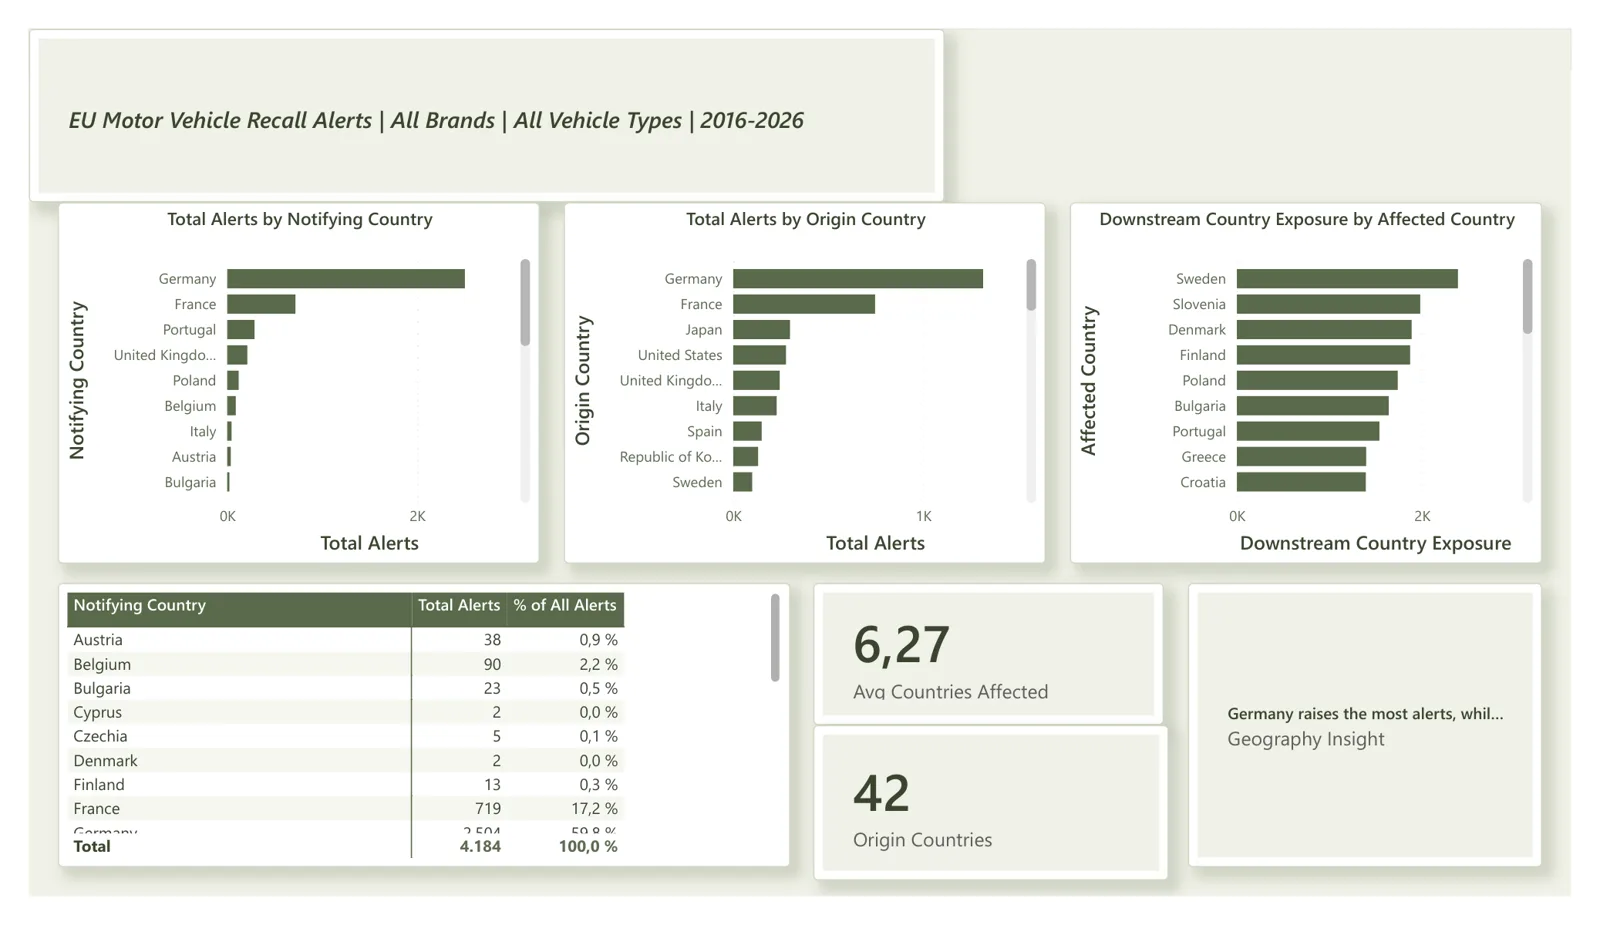
| Notifying country | Germany raises 2,504 of 4,184 alerts (59.8%) |
| Spread | each alert lists 6.27 other affected countries on average |
| Airbag / restraint alerts | 199 |
Checking the dashboard against the data
Recounting the numbers in Python showed that the first version of the report was quietly wrong in nine places. Two alerts were lost at the header row, the year table wasn’t connected (so the year slicer and year-on-year did nothing), keyword rules contained a stray tab and missed every braking and steering defect, and a null-unsafe check reported 0% missing descriptions instead of 20%. After the fixes, every card matches the independent count exactly.
What I learned
- A dashboard can look finished and still be wrong. An independent recount in a second tool is the cheapest way to find out.
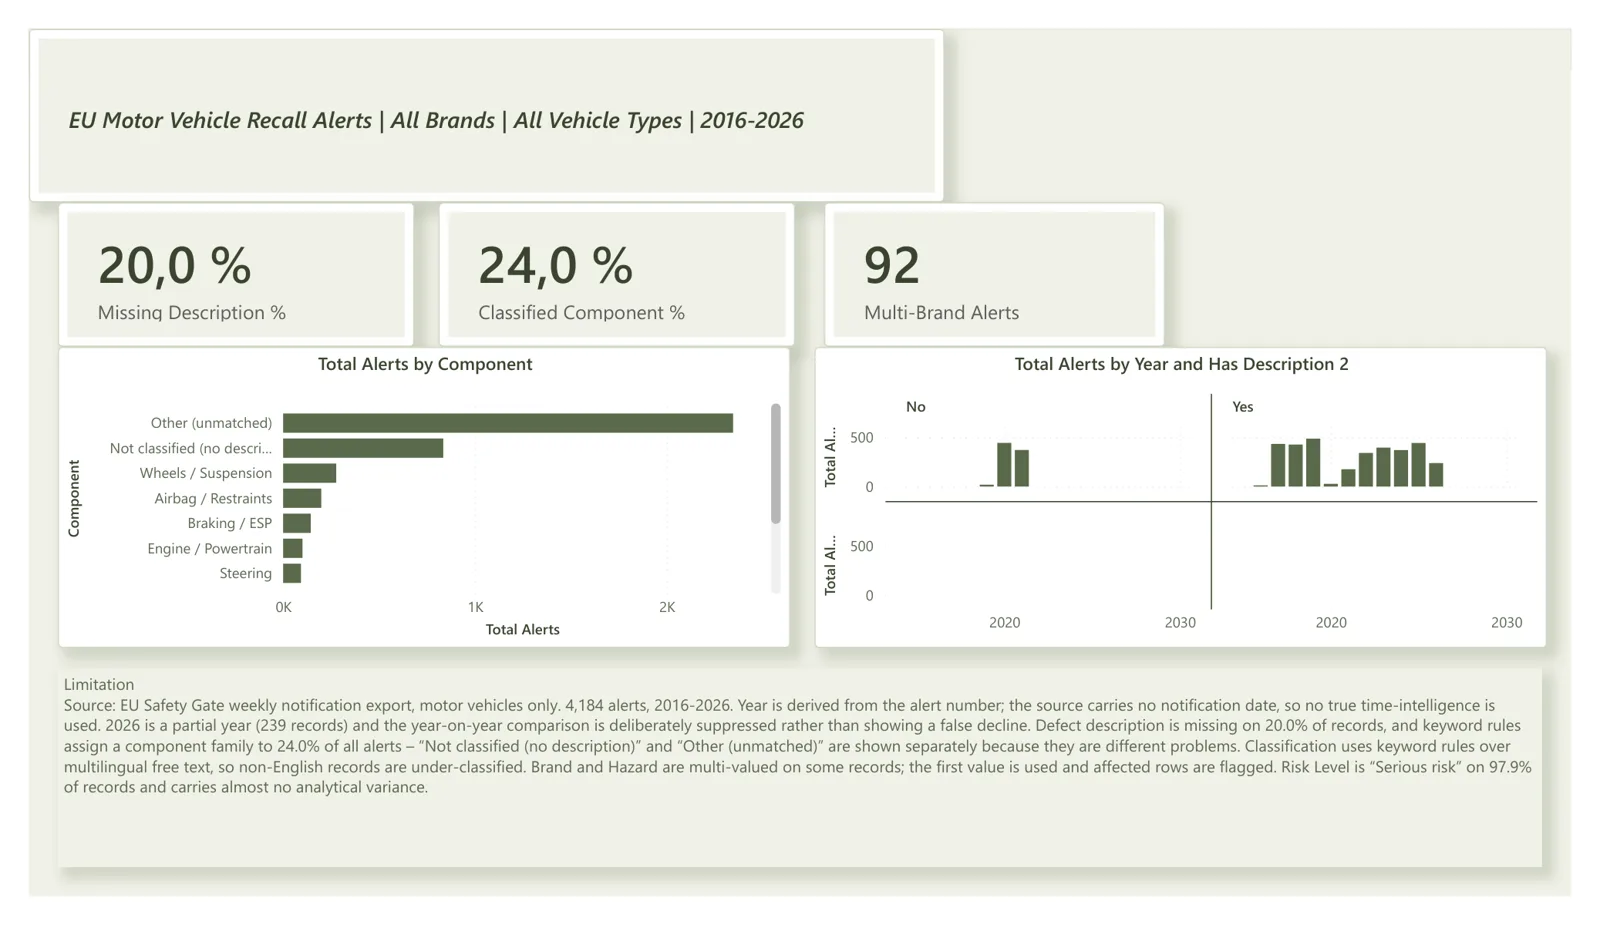
- Free-text classification needs to be honest about coverage: only 24.0% of alerts get a component family, and “no description” and “didn’t match a rule” are different problems.
- Nearly every alert is “Serious risk”, so risk level is a poor way to rank alerts; the hazard and component tell you more.